
Editor’s note: Seeking Alpha is proud to welcome Alpha Wealth Planner as a new contributor. It’s easy to become a Seeking Alpha contributor and earn money for your best investment ideas. Active contributors also get free access to SA Premium. Click here to find out more »
Eoneren
Introduction
Since earlier this year, after experiencing a significant period of market drought, crypto markets have begun to rebound, again presenting renewed opportunities for promising investments. In particular, the recent shift in sentiment has resulted in the asset class leader Bitcoin (BTC-USD) to surge more than 100%.
Investment Thesis
My investment thesis on Bitcoin revolves around the current wave of new-found euphoria in the overall market, the upcoming “halving” date on the horizon, and some discernible favorable patterns derived from a thorough examination and in-depth technical analysis of Bitcoin’s price charts. These factors serve as robust indicators, leading me to anticipate, with confidence, that Bitcoin is likely to finally surpass its $100k milestone as Indicators point to a bullish trajectory persisting into 2025.
Upcoming Halving
The upcoming Bitcoin halving, after current calculations about to take place on April 19, 2024, marks another pivotal moment for Bitcoin. This process involves a reduction in the reward that miners receive for validating transactions, essentially halving the rate at which new Bitcoins are created. Historically, these halving events have played a crucial role in driving upward momentum in Bitcoin prices. The scarcity introduced by the halving tends to fuel investor optimism, creating a bullish environment as demand outpaces the reduced supply. As illustrated in the accompanying graphic, past halvings have consistently correlated with significant price rallies, reinforcing the notion that this event holds substantial importance for Bitcoin’s trajectory and market dynamics.
Bitcoin Halving Overview (Investing.com)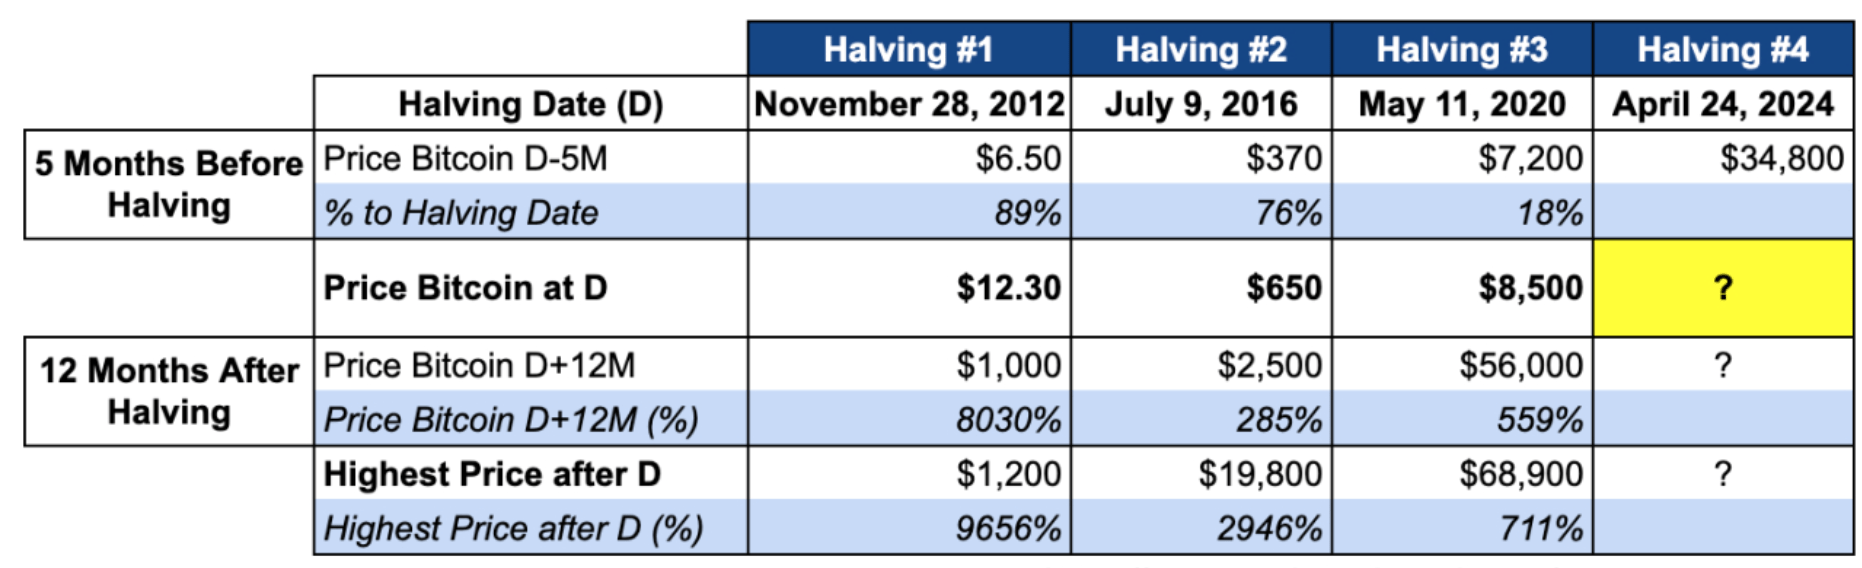
Elliott Waves
One of the most popular tools for analyzing the price movements of Bitcoin and other cryptocurrencies is the Elliott Wave Theory. This theory, developed by Ralph Nelson Elliott in the 1930s, proposes that market cycles are driven by the collective psychology of investors, which manifests in waves of optimism and pessimism. According to the theory, there are five main waves in a trend, followed by three corrective waves in the opposite direction. The aim of using Elliott Waves is to identify the start and end of each wave, as well as the potential reversal points, and to anticipate the future price action based on the wave patterns.
In the following, I used this exact technique to derive future price implications for Bitcoin. So now, let’s apply this methodology to some Bitcoin price charts that I prepared.
BTC: Multi-Year-Chart (TradingView & Author)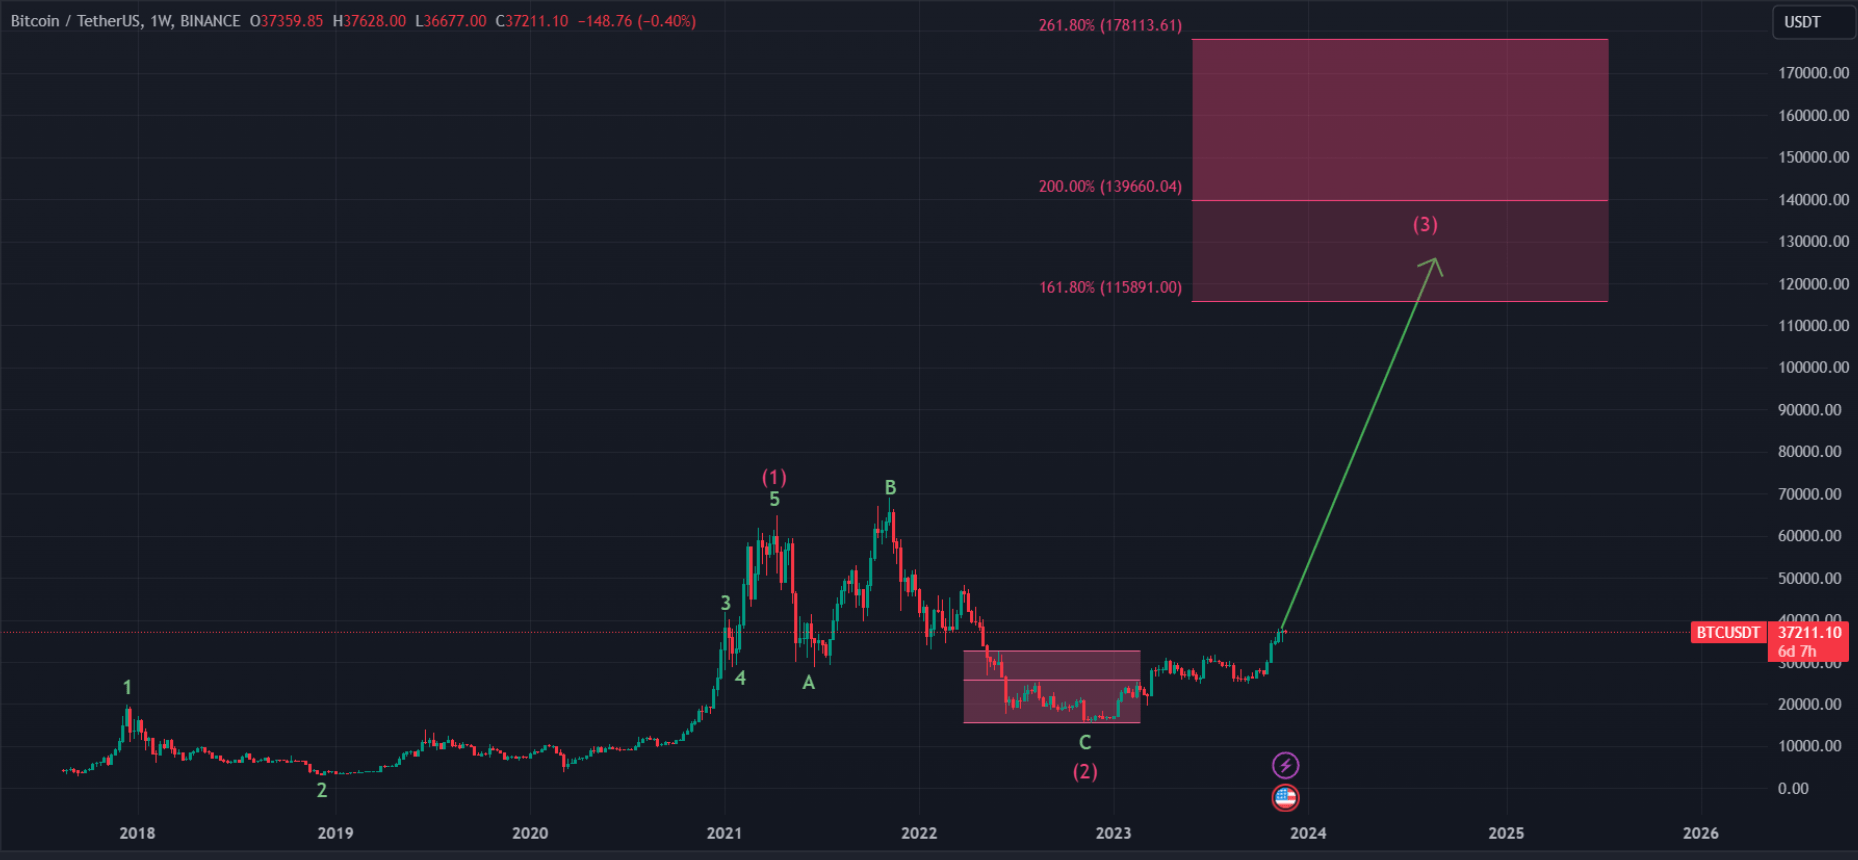
This first multi-year chart shows the completion of the first wave, labeled with a magenta 1. The internal structure of this wave consists of five green subwaves, confirming its impulsive nature.
The second wave follows as a flat correction, with an A-B-C internal structure. The B wave makes a new high, overshooting the previous peak. The C wave ends at the 78.6% Fibonacci retracement level, matching the low of Wave 2. This marks the end of the correction and the start of a new impulsive wave.
The third wave, which is still in progress, began in November 2022 and has been very strong and persistent. It is also impulsive, as shown by the five green subwaves. The minimum target for this wave is $150,000, which is the 161.8% Fibonacci extension of Wave 1. This is a typical projection for the third wave and represents the lowest possible scenario. However, given the tendency of cryptocurrencies to extend their waves, especially in bullish markets, Bitcoin could reach much higher levels than that.
BTC: Internal Structure, 3rd Wave (TradingView & Author)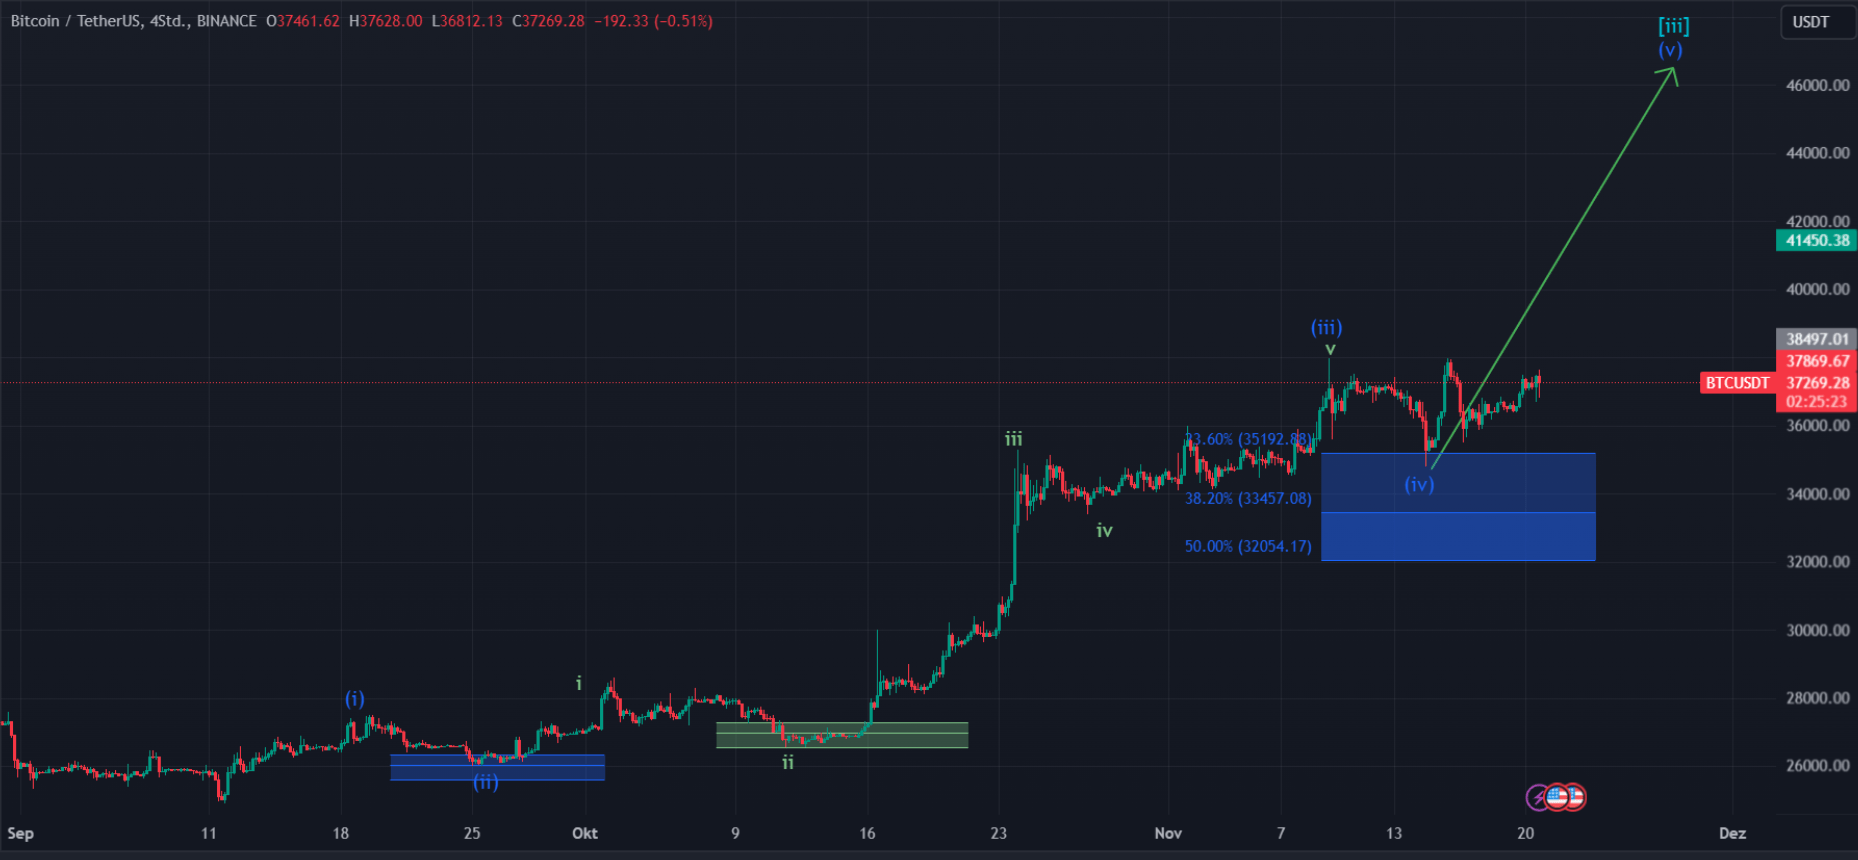
This second chart, representing the internal structure of the third wave we just ended with, shows a series of 1-2 patterns that have all been completed, indicating that we are now in the final stage of the 3rd wave (Turquoise). The internal structure of the Turquoise wave signals that it is close to finishing the dark blue Wave 5. After the Turquoise Wave 3 ends, we expect a Turquoise Wave 4 to follow, which could offer a good entry point for folks to load up on even more coins. In short, we are in the extended 3 of the magenta three from the previous chart, and this third wave is usually the most powerful wave with few retracements.
Internal Structure of the Turquoise 3 (TradingView & Author)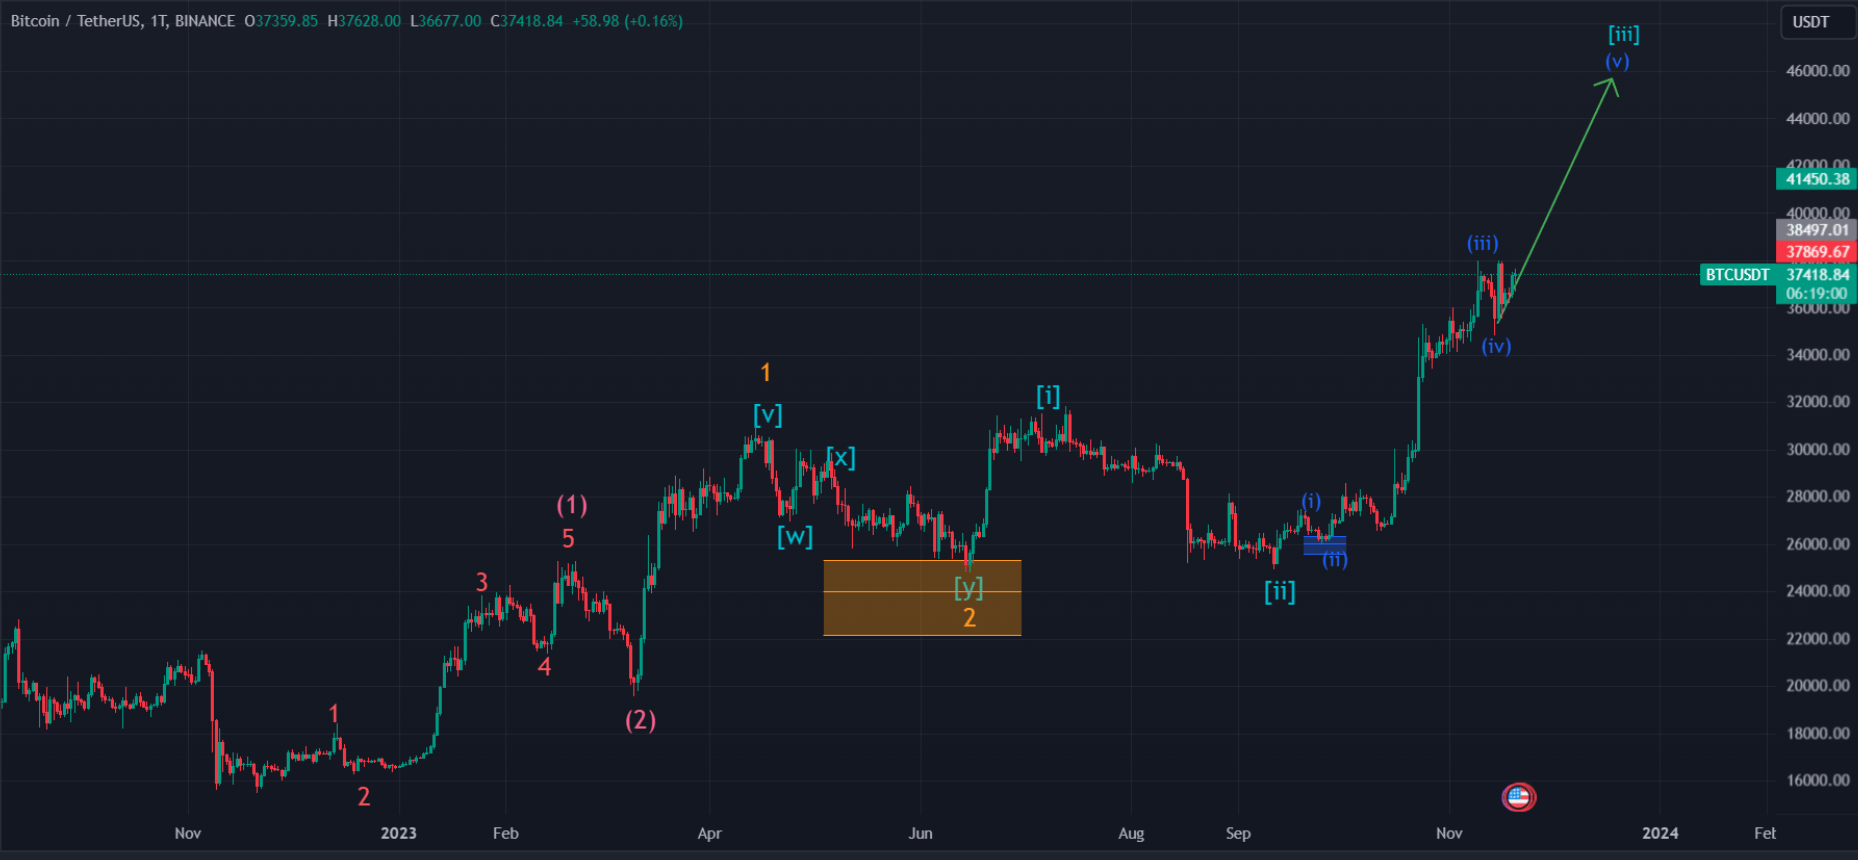
This final chart shows the internal structure of the turquoise 3 wave, which is part of a larger impulse wave. The dark blue wave has completed its five subwaves at about 38k, followed by a corrective wave that has reached the target zone marked by the dark blue box. The current wave is expected to be the longest and strongest of the impulse, and it has already surpassed the previous high of wave (i). However, there is still some resistance at this level, and a pullback into the target zone is possible before the wave resumes its upward momentum. Again, this could offer a favorable entry point for buyers who anticipate higher prices in wave (iv) and (v).
Risks To My Thesis
While my investment thesis presents a bullish outlook for Bitcoin based on the upcoming halving event and Elliott Wave analysis, it’s essential to acknowledge potential risks that could impact the trajectory I’ve outlined.
Cryptocurrency markets are inherently volatile, and external factors can swiftly alter the landscape.
Furthermore, the cryptocurrency market is heavily influenced by investor sentiment, which can change rapidly.
Also, unforeseen geopolitical events, regulatory developments, or macroeconomic shifts could lead to a sudden change in sentiment, impacting Bitcoin’s price trajectory. The evolving nature of blockchain technology and regulatory environments can significantly impact the cryptocurrency market. Changes in government regulations or advancements in competing technologies, even if regarded as unlikely, may introduce uncertainties that could affect the anticipated bullish trend. Other external factors: Bitcoin and other cryptocurrencies have shown a surprising correlation with broader markets in terms of reacting to macroeconomic factors, especially inflation and interest rate-related topics. Unfavorable changes in these variables could also cause a sentiment shift, leading to unforeseeable price movements in Bitcoin’s price
Conclusion
Ultimately, the confluence of factors supporting my bullish investment thesis for Bitcoin paints a compelling picture for the cryptocurrency’s future trajectory. The upcoming halving event stands as a key catalyst.
Additionally, the application of Elliott Wave Theory further strengthens the thesis. Nevertheless, the positive indicators from the halving event, sentiment shift, and Elliott Wave analysis underscore my optimistic outlook for Bitcoin’s future.
This analysis exclusively serves as an informational piece. While I present a positive outlook based on my perspective, it’s crucial to consider this information alongside other factors and individual risk tolerance when making informed investment decisions.
Read More:Bitcoin: Recent Crypto Euphoria Likely To Propel Bitcoin (BTC-USD)
2023-11-23 07:53:18